We know that learning to drive is an important step for many (typically) young Brits across the country. And taking your theory and practical driving tests – with the hope of gaining your pink licence – can be very nerve-racking.
However, our research shows that where you live can have a big impact on the outcome of your practical and theory driving tests.
Furthermore, the latest official statistics show that some learners may have to wait longer to start their driving lessons too (due to where they live), as the number of local driving instructors varies greatly across the country.
In this new report you will find the latest pass rates data from Britain’s practical and theoretical driving test centres* and much more.
You can use this insight to prepare you for your own learner driver journey.
Practical Driving Tests – Overall Insights
The average practical driving pass rate from all 328 test centres in the most recent data (2023/24) was 48%.
This is the same as in the previous year, but down 1% from 2021/2022, and down 2% from 2020/2021, which suggests it’s getting a little harder to pass or many learners aren’t as prepped as they used to be.
April sees the fewest major or minor faults handed out in practical driving tests, whereas November is the most common month for faults to be handed out to learner drivers.
A quarter fail their test due to loss of control while parking (25%) – this is the most common reason for an instant fail.
The most common DANGEROUS faults that lead to an instant driving test fail were (last 12 months):
1.Loss of control while forward parking – (25%)
2.Insufficient observation while at a junction (17%)
3.Failing to use mirrors when changing direction (10%)
4.Loss of steering control specifically (7.2%)
5.Insufficient observation while forward parking – (6.6%)
6.Failure to leave sufficient clearance when passing obstructions (4.5%)
7.Failure to judge risks at a crossing (4.5%)
8.Failure to judge risks when meeting another car (3.8%)
9.Failure to move off safely (2.5%)
10.Failure to maintain control of the car when moving off (2.1%)
Great Britain’s Practical Test Centres – Pass Rates
Scotland has the highest pass rates for practical tests, with nine Scottish centres featuring in the top ten. At least seven in ten learners successfully get their licence here.
For those in Cornwall, it’s worth heading to the Isles of Scilly where nearly three quarters of learner drivers pass (72.7%).
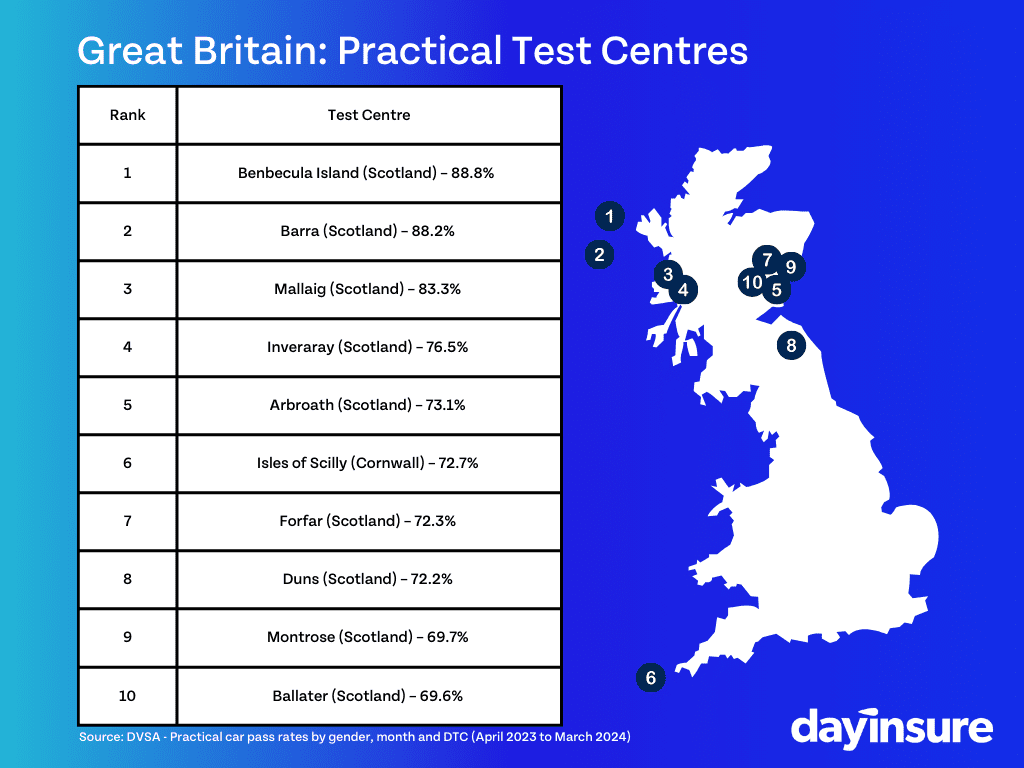
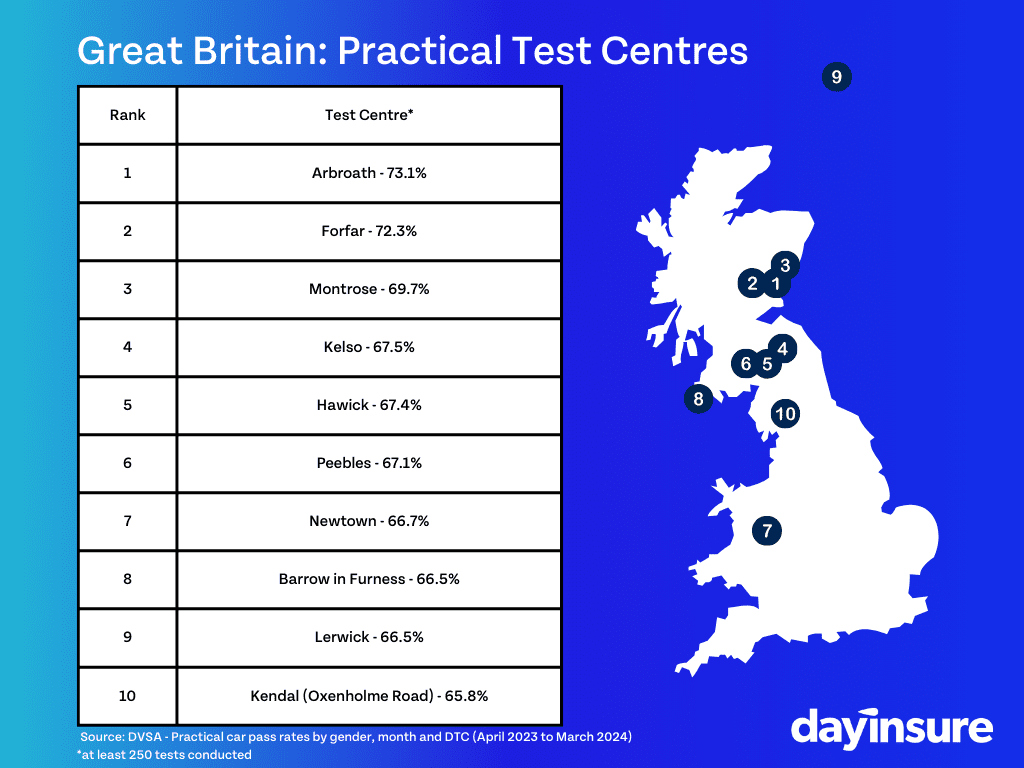
With a quick glance at the map, it’s not hard to spot the top ten test centres are all located in rural areas. This year, we added an additional filter to the data, and removed the smaller centres where only a low volume of tests was conducted.
To do this, we only included centres that had conducted 250 practical tests or more in the last year.
In this instance, driving test centres in Scotland still dominated the top ten centres for practical test pass rates, but a few other new places appeared on the list too.
Wolverhampton however appears to be the worst performing practical test centre in the country, with only around a third of learners passing their test here (32.4%).
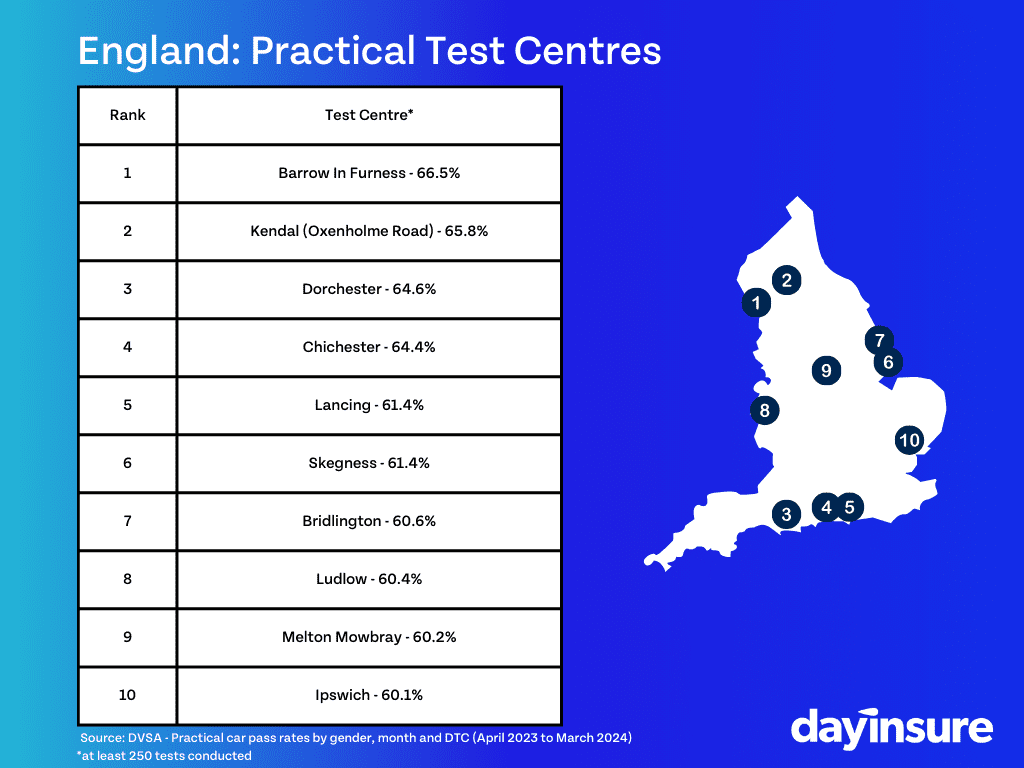
England: Practical Test Centres Insight
In England, Barrow in Furness in Cumbria is the best place to be for learner drivers, with over two thirds (66.5%) passing their test here.
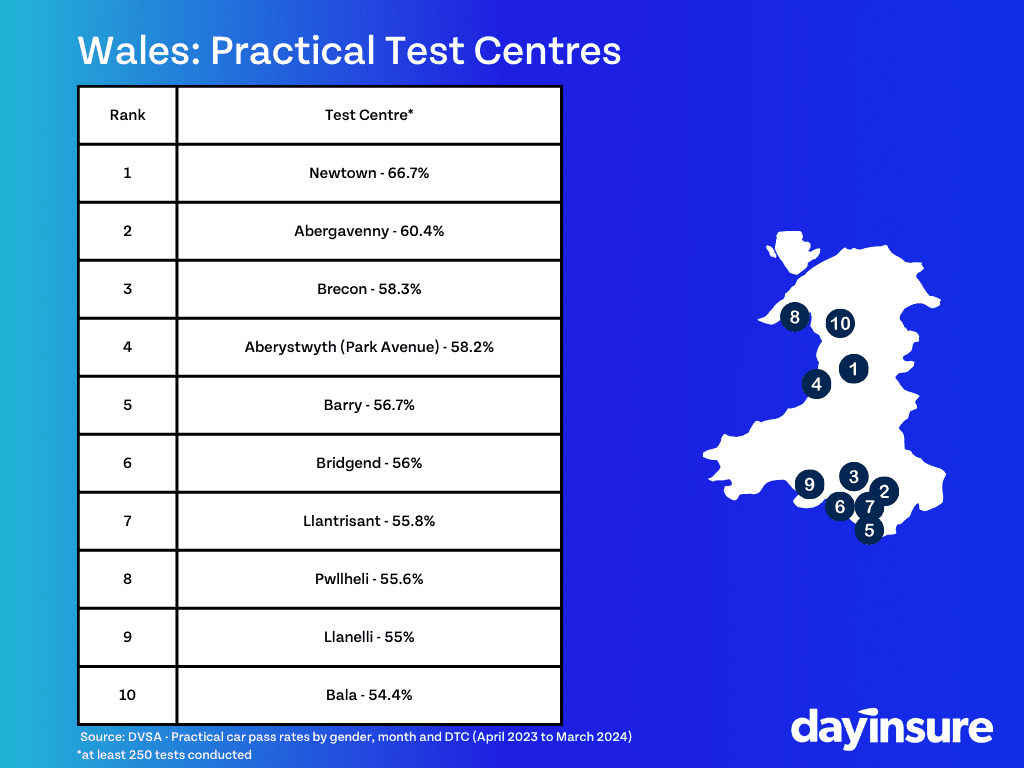
Wales: Practical Test Centres Insight
Across the border into Wales, Welsh learners should flock to Newtown in Powys, which has the highest pass rate in the country (66.7%).
Drivers in Newport appear to struggle the most, with less than half passing their test (47.1%).
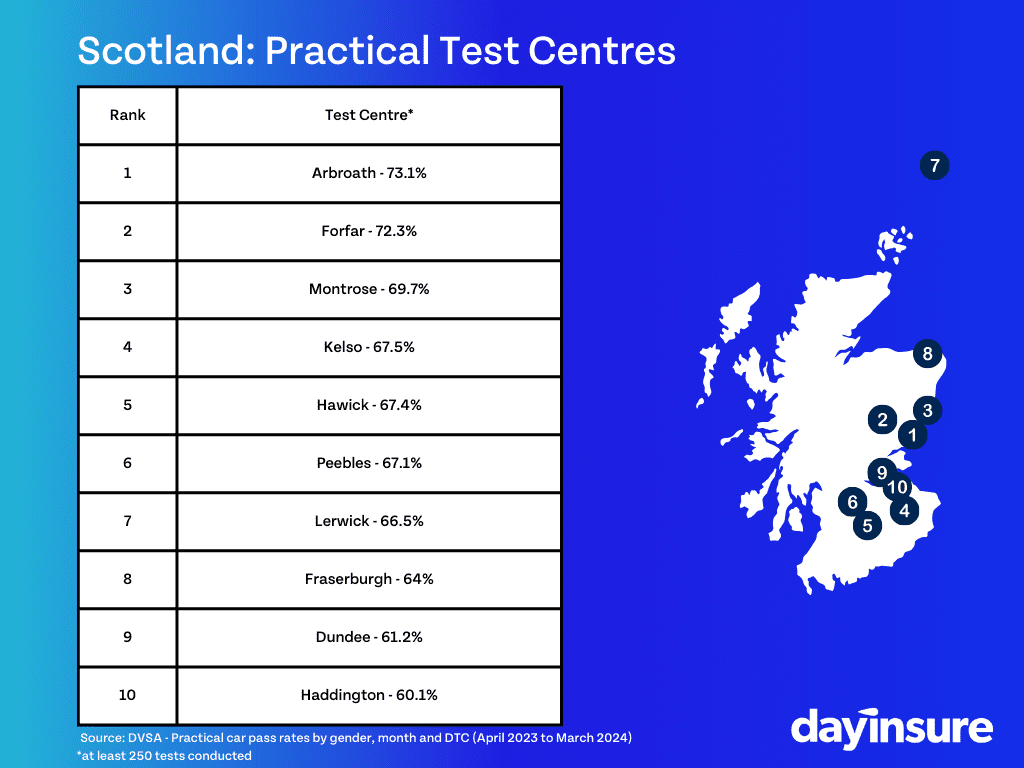
Scotland: Practical Test Centres Insight
While Scottish test centres took the majority of the spots in the British top ten, it isn’t easy to pass everywhere here.
The test centres in Scotland with the lowest pass rate were Shieldhall in Glasgow, with just two in five learners passing their test (40.9%), and Greenock, with less than half succeeding at the Anniesland centre (41.4%).
Theory Tests – Overall Insights
The average pass rate at the 201 theory test centres was 46.5% in the latest year’s data (2023/24). This is 2% higher than it was the year before (44.2%).
The theory pass rate was as high as 65% in 2007/2008 but has dropped below 50% from 2015/2016 onwards.
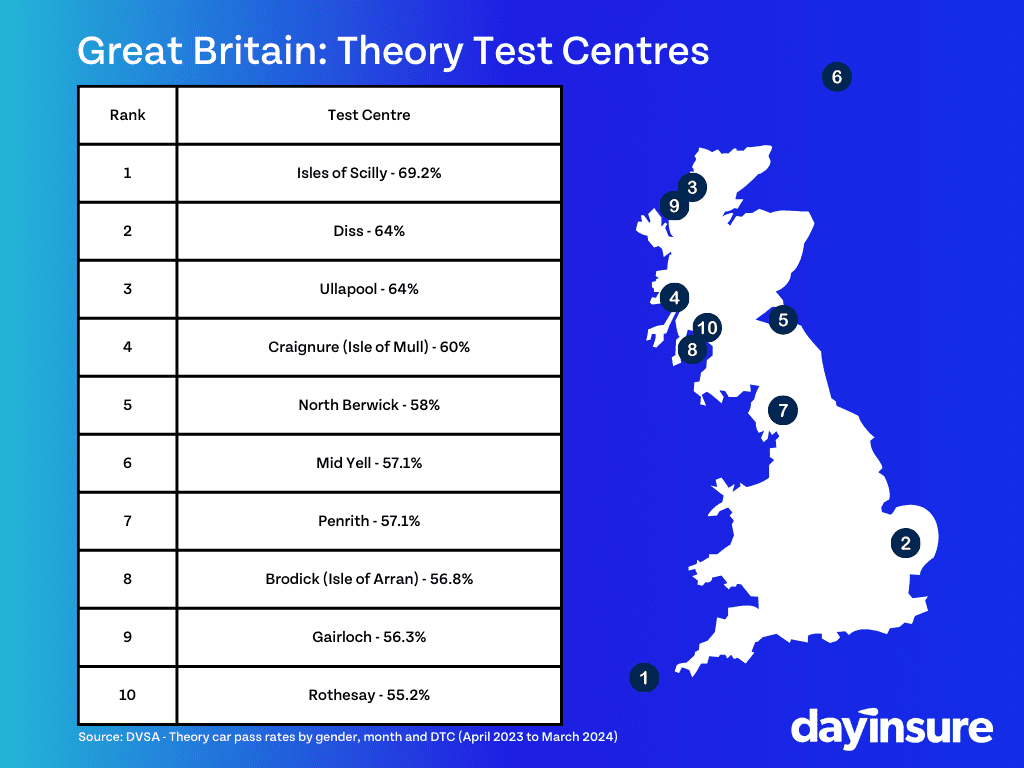
In a similar pattern to the top ten spots for practical driving test pass rates, the areas with the highest pass rates for theory tests in Great Britain were in isolated areas with low populations (six were in Scotland).
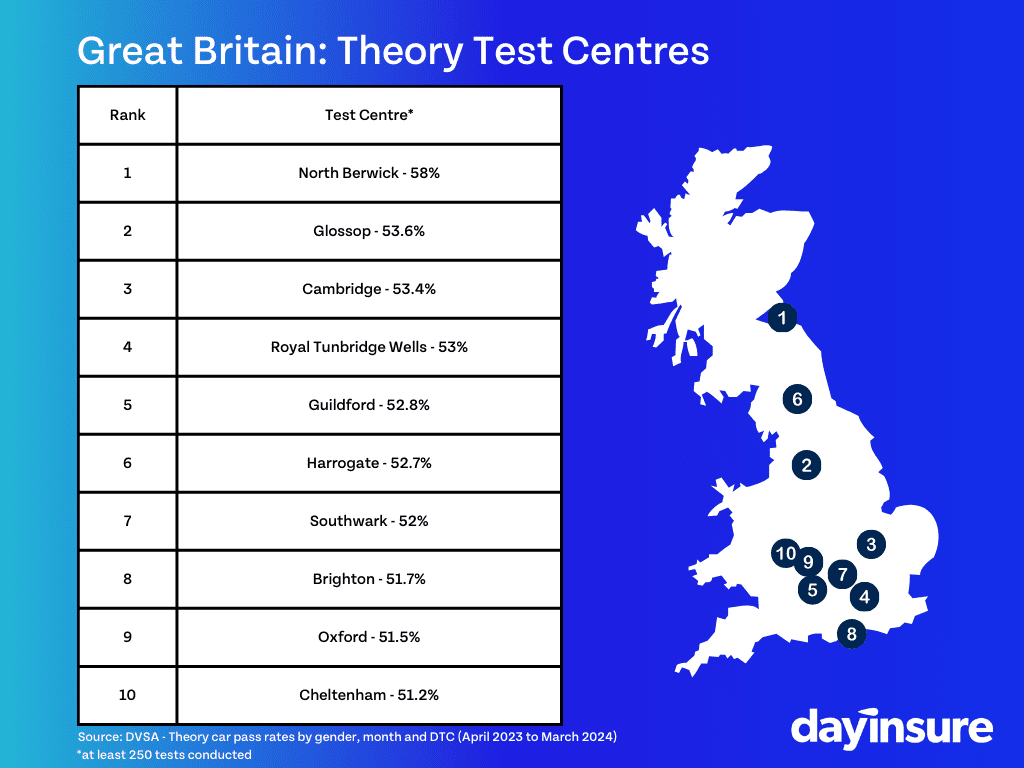
Great Britain: Theory Test Centres Pass Rates
Porthmadog in Wales has the worst theory test centre pass rate in Great Britain, with just over a third of learners passing their theory test here (37.3%).
Bradford came second after having taken the top spot last year (37.3%) for the worst pass rates, with virtually no improvement this year (37.5%).
Other test centres which ranked in the bottom ten include Dudley in the West Midlands (38.8%), Uxbridge in London (39.1%) and Leicester (39.6%).
Again, we ran the data with and without the small centres (conducting fewer than 250 tests a year) and the list came out a little differently, with many more centres in the south of England taking the top spots.
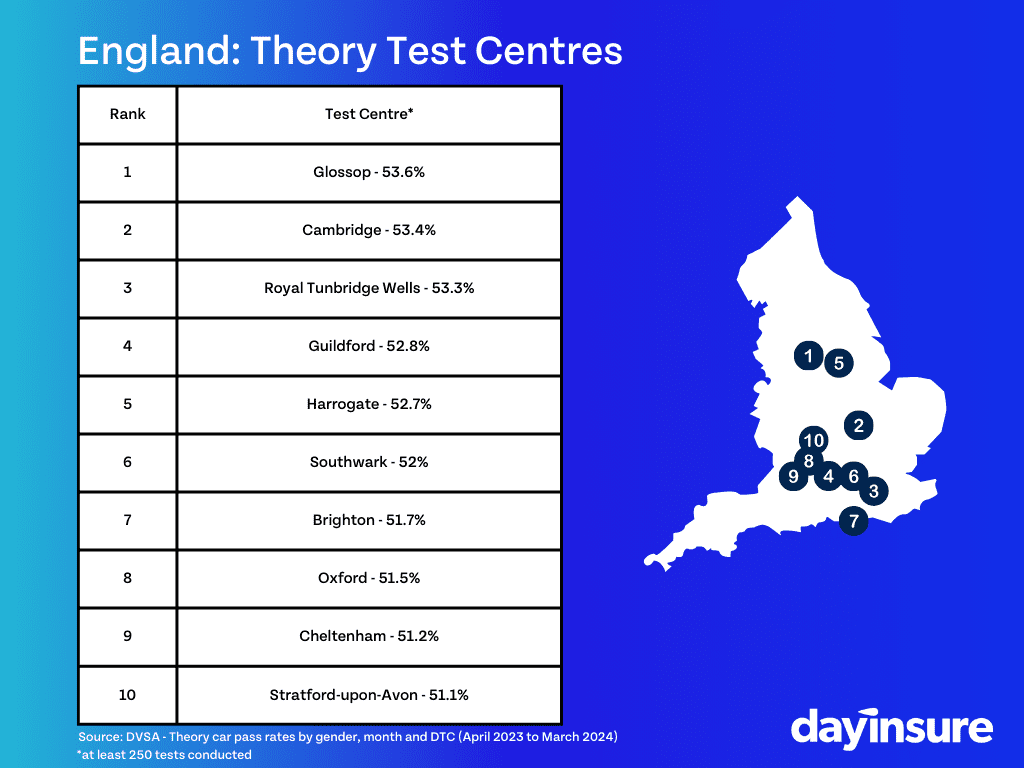
England: Theory Test Centres Insight
Even though Glossop (53.6%) took the top spot for the highest pass rate, England-based learners who are looking to pass their theory test typically have better chances of doing so down South.
Cambridge, Brighton and Oxford all boasted an average pass rate of more than 50%.
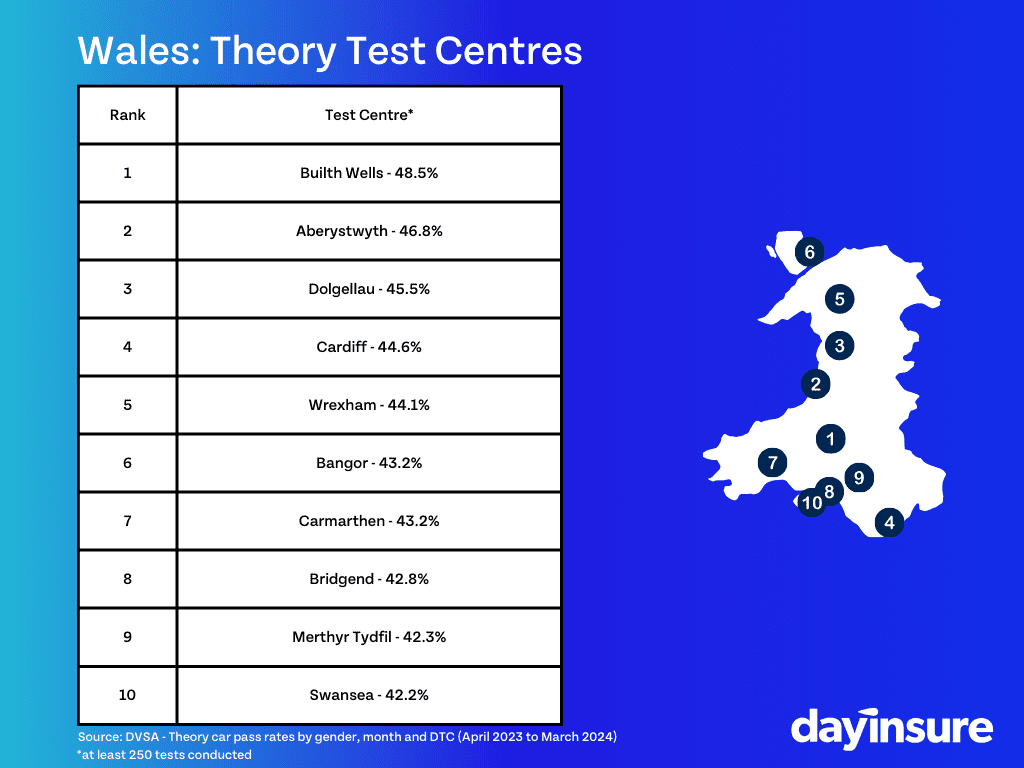
Wales: Theory Test Centres
Builth Wells is the most fruitful location for learners looking to pass their theory test in Wales, with around half of learners (48.5%) finding success here.
Although Aberystwyth takes the second spot (46.8%), it has seen a small decline since last year (50.2%).
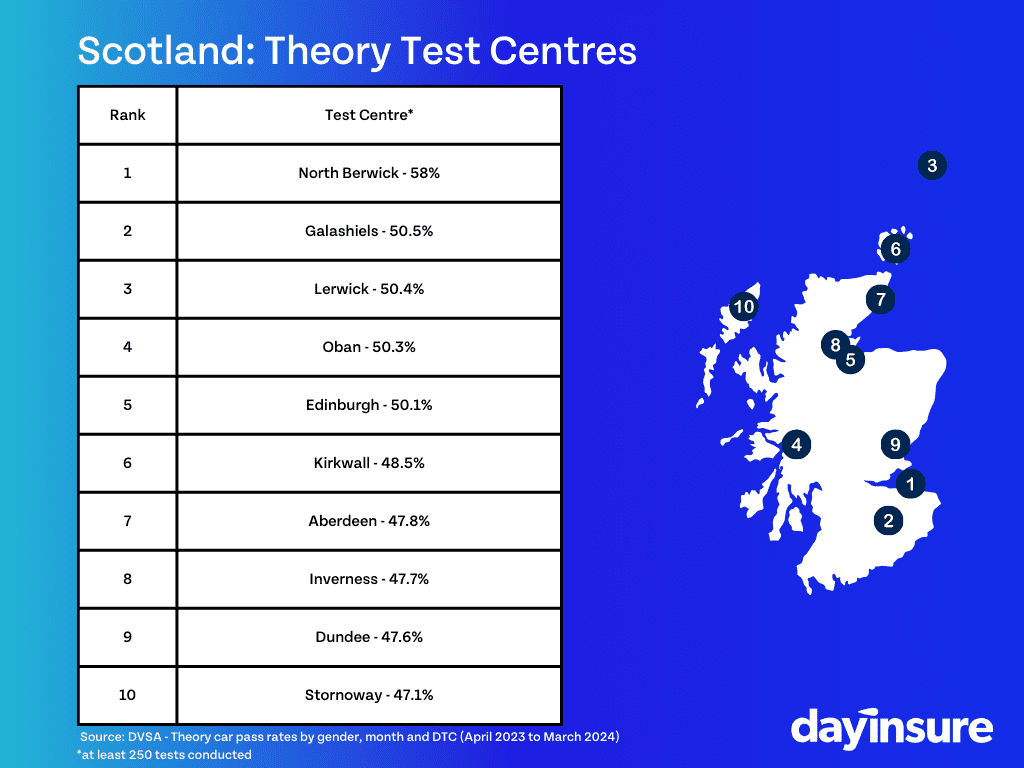
Scotland: Theory Test Centres Insight
North Berwick, a short distance from Edinburgh is the place to be for anyone taking their theory test in Scotland, with nearly two thirds of drivers (58%) passing here on average.
This is a huge uptick on Elgin (located on the north coast of Scotland,) where less than half of learners passed their theory test (41%) – the lowest rate in Scotland.
Access to Driving Instructors Across Great Britain
We also analysed the number of registered driving instructors up and down the country and found that some areas were awash with learners looking for an instructor, while demand is lower in other places.
Areas with the most learners per instructor offer good new job potential for anyone looking to become an instructor. The average salary for a driving instructor starts at £31k and rises to around £45k.
On average, there is currently one driving instructor for every 243 provisional licence holders. This is better than it was last year though – when there were 314 learners to every instructor.
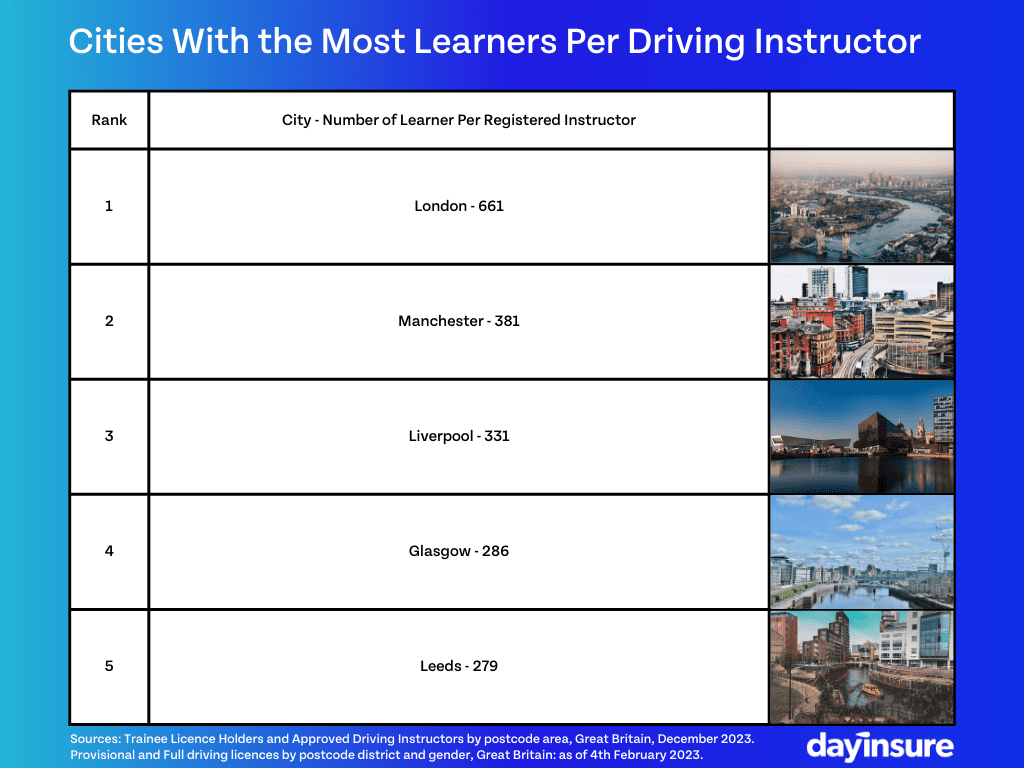
These are the towns or cities with the most learners per driving instructor (also offering the biggest opportunity for jobs for prospective instructors!):
1.London: 661 learners per instructor
2.Manchester: 381 learners per instructor
3.Liverpool: 331 learners per instructor
4.Glasgow: 286 learners per instructor
5.Leeds: 279 learners per instructor
6.Newcastle: 277 learners per instructor
7.Edinburgh: 273 learners per instructor
8.Oxford: 257 learners per instructor
9.Sunderland: 255 learners per instructor
10.Halifax: 248 learners per instructor
London has experienced a massive jump in learners since last year, with a 129.5% increase in provisional licence holders, placing London at the top of the table for the most learners per instructor.
The shortfall of instructors becomes even more apparent in the borough or London area breakdown. In West Central London alone, there are currently more than 1,300 learners for each instructor.
1.West Central London – 1311 learners per instructor
2.South West London – 892 learners per instructor
3.East Central London – 890 learners per instructor
4.West London – 875 learners per instructor
5.South East London – 692 learners per instructor
6.North West London – 682 learners per instructor
7.North London – 670 learners per instructor
8.East London – 494 learners per instructor
Average waiting times for a driving test in the capital continue to be the highest in Great Britain too, at 21 weeks (compared to the 15-week average).
On the other hand, here are the top 10 postcodes with the least learners per driving instructor (biggest amount of choice for learners / toughest for prospective instructors):
1.Llandrindod Wells: 125 learners per instructor
2.Colchester: 141 learners per instructor
3.Taunton: 147 learners per instructor
4.Salisbury: 153 learners per instructor
5.Chelmsford: 154 learners per instructor
6.Torquay: 154 learners per instructor
7.Worcester: 157 learners per instructor
8.Medway: 164 learners per instructor
9.Kirkcaldy: 169 learners per instructor
10.Ipswich: 170 learners per instructor
Learner Driver Insurance Requirements
Even if you haven’t yet passed your practical test, as a British provisional licence holder you’re legally required to have insurance when you’re driving a car under supervision.
If you are driving with a driving instructor, you are likely to be covered under their insurance – it’s best to check though.
If you want to drive outside those lessons with a friend or family member, you’ll need a valid policy. Check out our learner driver insurance page here for more information.
Conclusion
As you can see, learner driver pass rates fluctuate greatly across the country.
Furthermore, some areas offer great opportunities to find a local driving instructor, while in other locations learner drivers may struggle to find a licenced instructor to start driving.
Getting valuable driving experience is one of the best ways to get ready for your own test. However, it’s worth keeping in mind that you don’t always need to wait for a licenced instructor to start practising.
With Dayinsure, you can practise in a borrowed car (or your own), as long as you’re supervised by someone who’s aged between 25 and 75 years old, who’s held a British driving licence for at least three years and they’re qualified to drive the type of vehicle you want to learn in.
Before you jump in the car and start driving though, you need to ensure that everyone is fully insured to drive the vehicle. Our temporary learner driver insurance is a cheap and flexible option to get covered for your practice, offering coverage from just one day up to 5 months, and it only takes a few minutes to sign up.
Our Latest Report Sources & Methodology
- DVSA – Practical car pass rates by gender, month and DTC (April 2023 to March 2024).
- DVSA – Theory car pass rates by gender, month and DTC (April 2023 to March 2024).
- Trainee Licence Holders and Approved Driving Instructors by postcode area, Great Britain, December 2023.
- Provisional and Full driving licences by postcode district and gender, Great Britain: as of 4th February 2023.
- DVSA FOI Request: Test faults between 01/01/2023 and 31/12/2023 where Category of test is B and test result is Fail (Data received March 2024)
- Driving test waiting times insight https://despatch.blog.gov.uk/2024/02/07/how-driving-test-waiting-times-are-looking-at-the-end-of-january-2024/